TRADER DIARY
NOW YOU CAN TRACK YOUR OWN TRADES AND GET THE EDGE ON TRADING! THROUGH THE ARTIFICIAL INTELLIGENCE YOUR OWN PERSONAL TRADING HISTORY WILL BE PROJECTED INTO THE FUTURE SO YOU CAN SEE WHEN TO MAKE TRADES FOR SUCCESS AND WHEN TO LIE LOW.
THIS IS A MUST IF YOU ARE SERIOUS ABOUT TRADING
Introduction
This amazing program is really a trader’s delight! The basic premise of this software is very simple. It is based on the assumption that we work within a rhythm and all trades are based on a pattern, whether it is that of the trader’s individual habits or something else. As the cycle of life turns, we all experience times of plenty and success as well as lean times with less. When we are in the ‘flow’ life progresses easily without obstacles. Conversely, when we are out of the ‘flow’ life is beset with challenges. Thissoftware is designed to analyze these rhythms within our lives. By recording all of your successful and unsuccessful trades the Trader’s Diary will utilize that data as its research database and create a future forecast to show you when you are again in the cycles of making successful trades as well as unsuccessful ones.
Trader’s Diary at first glance
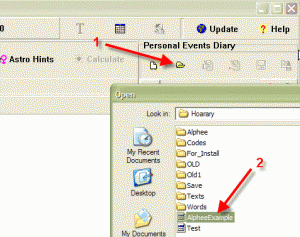
To get a forecast for trading, you need to record all of your past trades. Below is an example using the records of actual trades made within the past four years by a friend of Alphee’s. By the way, Alphee has created a special model for this forecast. You can find this example of the diary in your program under the name “AlpheeExample”. Run the Diary program and download this data file:
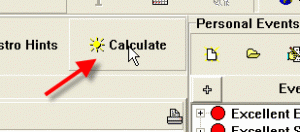
Click on “Calculate” button:
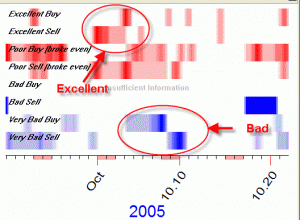
You will get this diagram:
This diagram represents good and bad periods for buying and selling stocks. The red color represents transactions with positive results (excellent trades and those in which you broke even) while the blue zones represent the times of losses.
In this example you can see that from late September to the first few days of October it is a good time to sell but when we reach around the 4th of October it’s time to buy. October 6 to 11 indicates a period of a high probability of losses as the blue zones are darker. At the very least, it indicates a time to proceed with great caution.
How it works
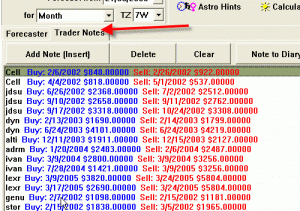
This program is very easy to use. Its flexibility allows you to correct and change the forecasting models as you trade. Click on the Trader Notes tab and all the trade information will be displayed in the dialog box.
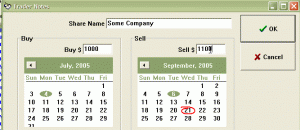
If you would like to add any new information, open the Trader Notes page and click on the “Add Note” button or click the “Insert” key on your keyboard. The following form will appear:
In this dialog box enter in the trading name window the stock symbol or name of what you are trading. Input the date on the calendar on the left when you bought it and the enter the date you sold it on the calendar on the right. Input the dollar amount for both the buy and sell. When you have finished entering your trade information click on the Note to Diary button to enter this new information.
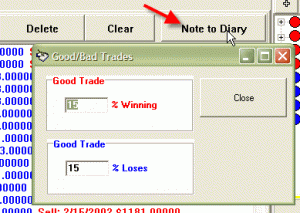
Notice that there is a choice in the About Dialog box allowing you to change the percentage of what you consider a good or bad trade. All this means is that any gain of 15% would be a good trade and anything under 15% would be a bad trade. This percentage can be changed at any time even after you have input all your trade information. Sometimes when I calculate my forecast I like the to change these percentages to see how we change the trading days.
In the open dialog box indicate your estimate of the trade’s outcome: excellent/poor/bad/very bad trades. Then click on “Calculate” button to get the new forecast diagram. You will find it on “Forecaster” page.
What the forecast is based on
By default, we use transiting aspects to natal planets and the Moon’s position in Zodiac. But you can change the forecasting model as you wish. Click on this button:
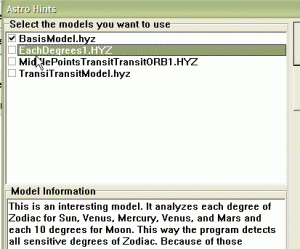
Here you will get the list of 4 different astrological models that might be applied to your forecast:
You can use these models separately or combine them simply by enabling the model’s name. The brief description of each model is provided as well.
Some of the models use your birth data (including time and place). If you do not know your exact birth time, it is recommended to use the “EachDegrees1.hyz” model. This model analyzes each degree of the Zodiac for the planets impact, revealing the “hot” (sensitive) zones of the Zodiac and produces the forecast accordingly.
Enter your birth information to create your personal diary
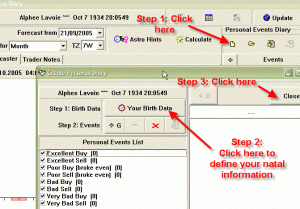
To create your own personal diary just follow these easy steps shown below:
Step 1: Open the Diary.
Step 2: Enter your birth data.
Step 3: Close this window (save the Diary data in the file; name the file as you wish).
After that, go to the “Trader Notes” page and enter your trading history. After all is calculated the forecast will appear on the “Forecaster” page.
Thanks for using our software,
Price $129.00-$299.00 US Plus S&H
