Alphee’s Trading System 2
THE ALPHEE TRADING SYSTEM 2
The Alphee Trading System2 software is an extension of the ALPHEE’S TRADING SYSTEM 1. It gives you all of the features in the ATS 1 plus more forecasting features to make you a better trader.
The ATS 2 has lots of very exciting modules to help you trade more efficiently and successfully. When you have more different techniques pointing to the same day to buy or sell the more accurate your buy and sell will be to make money. The ATS2 has over 18 different forecasting techniques.
The AST2 cost $998.00 If you already purchased the ATS 1 then the investment in ATS 2 is only
$499.00.
Video to watch: https://alphee.com/ats/ats2.pdf
The most notable forecasting techniques are described below:
THE PHENOMENA MODULE
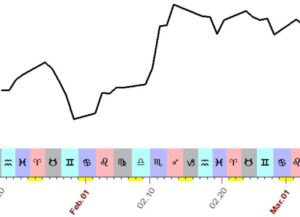
This feature allows you to view different astrological criteria on the stock that you are trading. It allows you to view the Moon positions, planetary positions, planets direct or retrograde, planetary house positions, terms/phase/degrees/duads, planetary hours, and more. The following diagram shows the Moon in sign on the price graph. You can watch what it did to the market.
THE EPHEMERIS MODULE:
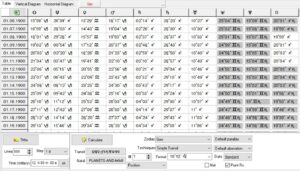
This module enables you to look at the ephemeris table for different types of zodiacs. You can calculate planetary positions in geocentric, heliocentric, right ascension, declination, geo-latitude, helio latitude, sidereal, and declination long. It also has the ability to view all these ephemeride tables on the vertical or horizontal graph known as the graphic ephemeris. You can save these tables or print them out. You can spot retrograde planets quickly because they are highlighted. You can also calculate and display the asteroids Chiron, Ceres, Juno, Pallas and Vesta.
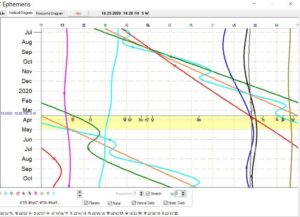
With the graphic ephemeris module you can watch an IPO chart and how it’s affected by transits. The natal
chart is displayed in yellow and you can move it up and down and check the date that it crosses the transiting
planet.
THE SUPER SEARCH MODULE:
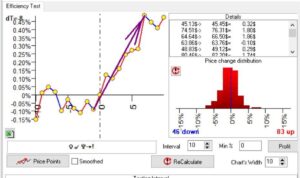
This feature calculates hundreds of Astrological/Astronomical criteria and ties it to the stocks’ historical price. It works with the efficiency testing module to study the strength of any criteria. You can set it to work with only one criterion or many criteria at one time. It allows you to work with planetary positions, aspects front and back, planets direct or retrograde, midpoints, speed of the planets, phases of planets, orbits, planetary pictures and much more. You can make a study of how they affect the market that you are studying.
The following graph shows how Venus conjunct Pluto affects the Dow Jones price in the past. If you look at the graph you will see that from the exact aspect to ten days before and after the aspect the Dow Jones went up 83 times and down 46 times. You can also view all the days that this aspect happened and what the market did in percentage up or down. This is a very powerful module for the stock trader. We know that the Dow Jones wants to go down after the full Moon. If you want to check that out or see future full moons this is the module that can do it.
THE ASTROCLOCK MODULE
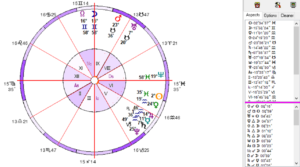
Start by setting your physical location. When you bring the Astro clock up it uses the computer time and your set location to calculate a chart for the moment. You can send the Astro clock down in a tray and at any time bring it up again to see the chart of the moment. It’s a great feature to follow what’s going on in the sky. You can also bring up your natal information in the horoscope wheels and view how the transiting aspects are affecting your natal chart at the moment. If you keep the Astro clock on your screen it will recalculate every 15 seconds and readjusts everything in the wheel.
THE ANALOGY MODULE
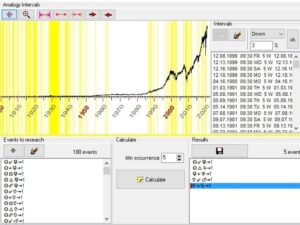
This feature allows you to set the percentage of a stock moving up or down and then load astrological criteria to see which criteria causes this to happen. In the diagram below you can see which criteria caused a 3% move down on this market under study.
THE DAILY MODULE
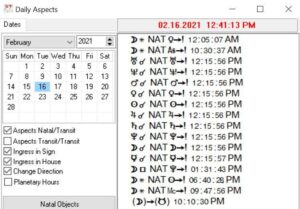
It’s so neat to see what’s happening in the sky daily or in an IPO chart. You might want to find out when the planet turns retrograde or ingresses into a new sign. This is a valuable module for intraday traders to see when transiting planets make a positive aspect to the angles which is very important for intraday trading. This module will do it for you.
THE EASYEXPERT MODULE
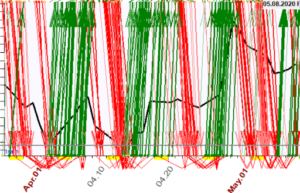
This is an incredibly powerful module. It calculates a stock trending up or down using statistic mathematics providing the analysis of hundreds of astrological phenomena and gives you the forecast based on this analysis. You can see how strong the trends are by the color density and the amount of arrows. This is a great asset in stock trading.
THE BLACK BOX EXPERT MODULE
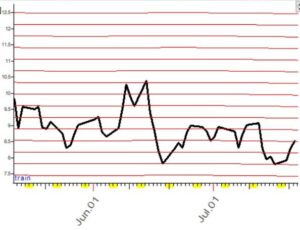
This module is the backbone of the Market Trader Titanium program. It utilizes all types of statistical and fuzzy logic mathematics to educate the artificial intelligence using past historical stock prices. When the artificial intelligence conforms with the historical stock price, the module projects the graph into the future to help you make decisions on when to buy and sell the stock
PLANETARY LINE MODULE
Planetary lines are great feature to show Resistance and Support lines of the stock you are trading.
Remember that the Alphee Trading System 2 has all the features that Alphee Trading System has. So if you don’t own the Alphee Trading System 1 then go check the features that it has.
