Fast Research – Fast and Accurate Research without tears
All software programs have been updated. The full version is the very latest and contains the update. If you already own the previous version click the updatebutton to purchase.

No need to be a Ph.D. to do accurate scientific research! Our new Fast Research does all the statistical mathematics in the background for you. It is one of the most powerful astro-research programs available today. You can input hundreds of astrological astronomical criteria and the program will calculate the probabilities and chi-square. Then the module will assign weights for the strength of each criterion and from that create a model to compare it with other chart files. There is no program on this planet earth that does this….and this is only a fraction of what Fast Research can do.
$129.00 – $299.00
Fast Research Software Program
Bringing new dimensions to scientific research
The Program comes with a database of 25,000 charts
THE RESEARCH PROGRAM GOES WAY BEYOND SIMPLE RESEARCH
You can put a set of data and have the neural net artificial intelligent find out what do all these have been comments. These calculations go way beyond standard criteria. Find out how many of these moves together in unison and that is more
This is the smartest Astrological research program ever written. All you need is a data file that you want to research and the program will take care of the rest. Its artificial intelligence will set all of the research parameters for you. It will generate a learning, testing and control group. It will generate all the probabilities with which to compare it. It will set up all the dispersions. We have a choice of three different algorithms to generate control groups. You can generate as many control groups as you want for the same research project. After setting all of the parameters, the program will use advanced NeuroNet and fuzzy mathematics to conduct the analysis. It will pass the data through rigorous statistical rules and mathematics to arrive at its conclusion.
If you don’t have a Ph.D. in statistics and you want to do research, then this is the program you need.
You can set the research to work with just a few criteria or hundreds of criteria. You can research anything in the sky and even things that most Astrologers do not use.
THE STRENGTHS OF THE ASTRO INVESTIGATOR SOFTWARE
It research aspects (front and back), midpoints, zodiacal positions, speed and speed differences of planets, retrogrades, direction and acceleration of planets, eclipses, occultations, Moon & planetary phases and aspects between phases, orbits, ascending and descending nodes, speed difference between planets, Perigee, patterns such as stelliums, grand trines, grand squares etc., house rulers, void of course, first and last aspects of the Moon, house and his zodiac reception, planetary dignity, waxing and waning, Apogee, midpoints, coordinates and much more. Astro-Investigator will research degrees of the zodiac, Harmonics, strong and weak signs, quadrants, hemispheres, planets in house & signs, dwads, decanates, Moon & planetary phases and aspects between phases, elements, qualities, midpoints structures, planets rising before the Sun or moon, first and last aspects of the Moon, signs on the house cusp, aspects to a point, planet rulerships in house, signs and aspects, mutual receptions, Parallels, counter Parallels, planets, borderline signs, stelliums, midpoints, house and his zodiac reception, planetary dignity, waxing and waning, solstice points, planetary pictures, speeds and accelerations, planets, occultations, moving fast or slow, perihelion, aphelion, ascending and descending nodes, Marc Edmund Jone’s chart types, major aspect patterns and much more.
It can be as simple as you want or It can be really complex. In other word You can research if the ruler of the Midheaven is in the third house and square Mercury in the fifth house or squares the ruler of the fifth house. You can find if the ruler of the midheaven is retrograde and squares planet in the ascendant . Mix and match all different kinds of Astrological criteria to research. It works with 43 predictive techniques! Choose 23 different aspects, either front or back, or make your own.
It Works In: Geocentric, Right Ascension, Heliocentric, Declination and Latitude. Set of planets to be calculated with or without parallax or abberation.
This program is everything that you need to do a scientific research. It calculates your control group, probabilities, chi-square. All your results can be saved in an Excel sheet. It creates its own weight as to how strong each astrological criteria is. It works in geocentric, heliocentric zodiac. If something moves in the sky, you can research it with this program!
Here are some of the astrology /astronomy criteria that you can research:
Planets position in zodiac, and in house, cusps position in zodiac, the high/low planet, intercepted planet, zodiacal reception between planet and between houses, first planet before sun or the moon, borderline placement, planetary pictures, Arabic parts, planet is direct/retrograde, planet moves fast/slow/stationary, planet accelerates/slows down/speed and speed difference, planetary phases, works with all major aspects or you can make your own, also aspects with midpoints or aspect in planetary phases, house rulers in positions and aspects, occultations, planetary patterns for is the last moon aspect, void of course, exaltation, fall, detriment, Ptolemy terms, Egyptian terms, decanates, faces, harmonics, planetary hours, declination, latitude, planet is perihelion or aphelion, perigee, apogee, planetary nodes and much much more. And, it’s fast and accurate, too!
THE RESEARCH PROGRAM GOES WAY BEYOND SIMPLE RESEARCH
You can put a set of data and have the neural net artificial intelligent find out what do all these have been comments. These calculations go way beyond standard criteria. Find out how many of these moves together in unison and that is more important than criteria’s move and one at a time. You can then save these models and then compare it to a chart file.
Two different ways of analyzing research data
There are two ways of analyzing your research. You can set as many Astrological/astronomical criteria as you want to analyze the data and then compare it against probabilities. This will allow you to examine how important each criteria is in the research. For example, this way you can find out that 50 percent of your criteria has Saturn conjunct the Ascendant. This kind of information is valuable to Astrologers.
Two ways to analyze research data
The second way is to analyze multiple Astrological astronomical criteria at the same time. Let the program’s artificial intelligence determine how important each criteria is and give weights for each criteria. You can send each weight to rigorously statistically test it and if it passes each of the tests the program will let you know and give a percentage strength for your research findings. If the program finds correlation you can save these weights to a chart file and then use it to compare it against other chart files. My feeling is this is a better way of doing research because you can utilize the findings and put these results to good use.
After loading the data file to research, the program offers many features to manipulate the data and settings. These can be set by the user.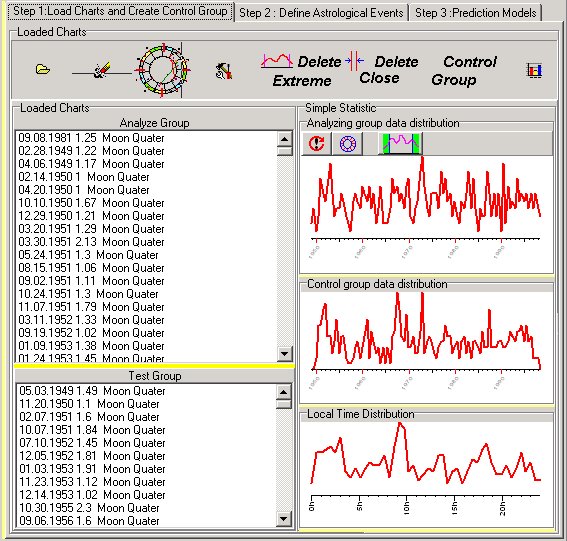
Cleaning Up The Data: The program deletes all the charts that may affect the research. Let’s say that you’re doing a research on earthquakes and the data shows two earthquakes that happened at the same time and in close geological proximity. Using both of these charts may adversely affect the end result of the research because there are so many criteria that will be the same in those two charts. Deleting some more charts can be beneficial to an accurate and more valid research. If doing a research on people names then this would be fine.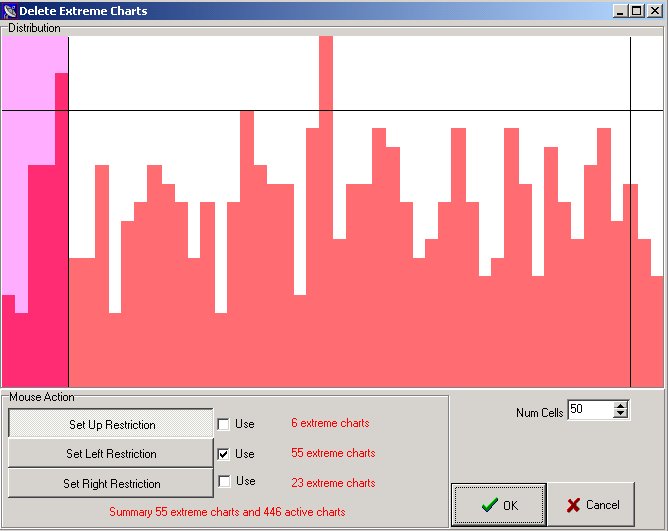
Creating special charts to work your data
Let’s say that you have 40 years of days when there was over 1 inch of rain. You want to create quarter Moon charts for these days because sometimes the results are better when analyzing New Moons or Moon Phase charts, or maybe ingress charts, etc. This module allows you to create different chart files from a regular chart file. This module creates charts from a database for Moon quarters chart, Lunar Returns, Solar Returns,ingresses of any planets, and planet either turning direct or retrograde for every chart in a database. These charts will be created for the day and time that these events took place prior to every date in a database.
Individually checking all the calculated criteria’s validity
This is the first way to analyze research data
After all the settings are completed the program will calculate all the number of times that the criteria happens and will compare it with the probability of time that it should happen. It will then display how important the criteria is. You can examine every criteria that was calculated. It will display the amount of times that these criteria happened against the probability that these criteria should have happened.
Output results for days having over 1 inch of rain in Connecticut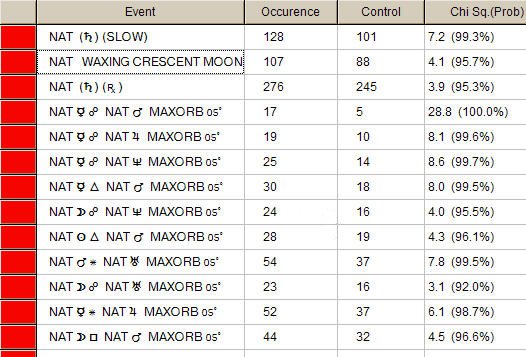
Displaying Points and Aspects more involved in the research
This displays which planets are most often and most seldom involved in the research.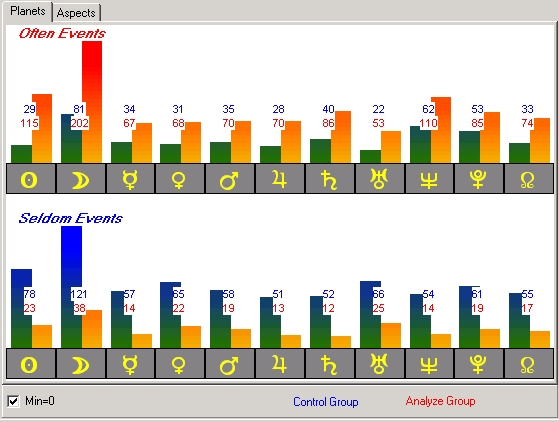
This graph indicates the aspects that are most involved and seldom involved in the research.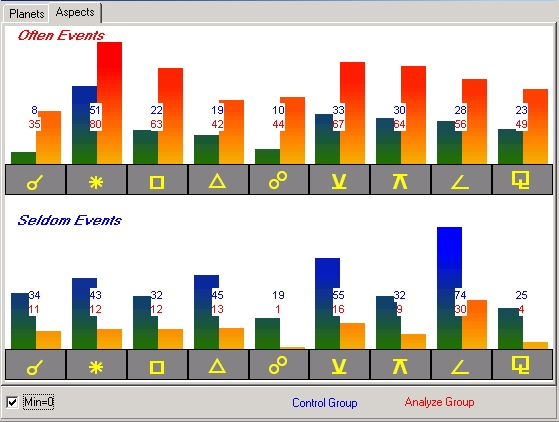
It Calculates and graphs the Gauquelin Sectors: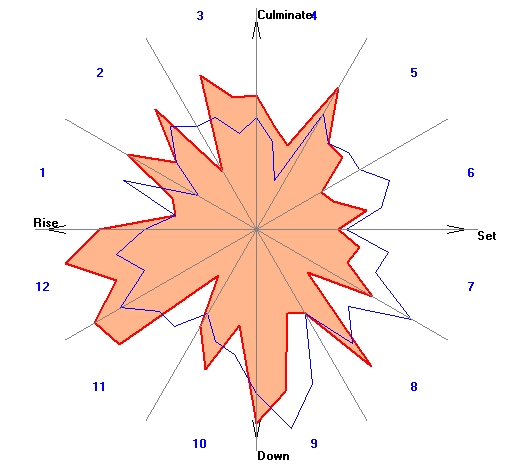
The Bolter Mathematics Module: Checks all the criteria to see how statistically sound they are and if they are not, they are deleted according to a preset statistical percentage.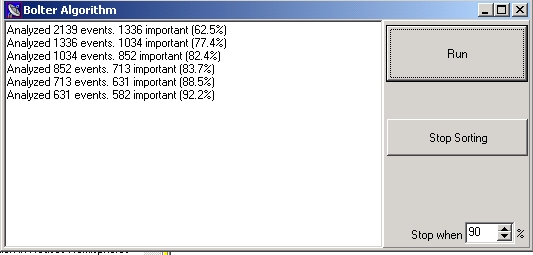
The second way to analyze research data
This method uses artificial intelligence and sophisticated NeuroNet and fuzzy logic mathematics. It will determine how important each criteria is and give weigh to each. There are two different modules to analyze your research data using this method. One is called the Blackbox module and the other is called the NeuroNet module. Both use different types of mathematics and if both modules arrive at the same conclusion then you have a positive indication that your results are statistically sound.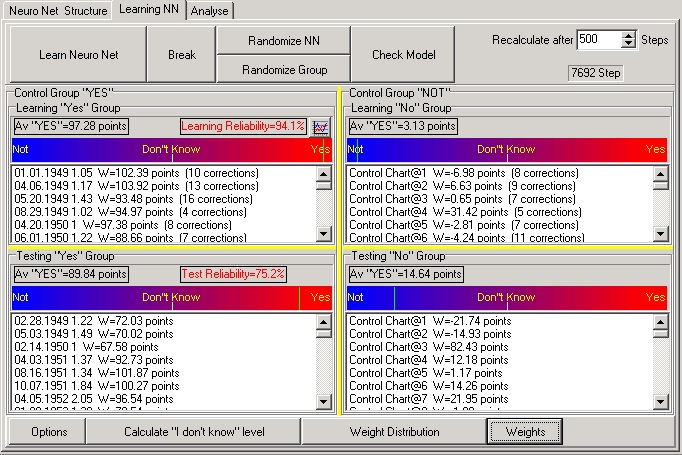
The weight distribution gives a graphic view on how well the research is holding to the statistical results
Let’s take the example of the 80 doctors. We set a control group of 20 percent. 64 doctors were used for the learning group and 16 for the testing group. Then at random access we did the same thing, 64 for the learning group and 16 for the testing group. Look at this graph. There is a graph in the dialog box and another one down in the dialog box. Both of them have red and blue histogram bars. The upper graph shows the blue graph as the learning group or the real doctors and the red graph as the learning random access group, non doctors. At the bottom the same thing happens; the blue for the testing group of the real doctors and red for testing random access non doctors. If the red and the blue graph are on top of one another that means that there’s no difference between the real doctors learning group and the random access learning group. The same is true between the testing group. If the graph shows the blue and the red are spread out it indicates that NeuroNet is finding a lot of differences between the two groups. Of course that’s what we are looking for. The more differences between the two groups, the more that indicates that the research has validity.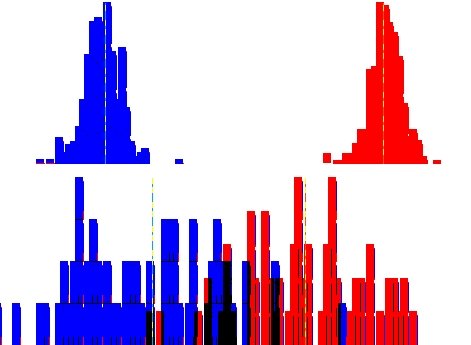
Testing the statistical results
This is a very important module in the Astro Investigator program. After you run the NeuralNet through the A.I. Optimizer and receive good results use this module to re- test the results to insure that the test results are valid.
It will take the learning and testing groups, mix them up, and go through statistical mathematics to determine how well the results hold statistically. After it has gone through 30,000 passes it will re- mix the learning and testing group again and repeat the same process. The program will continue doing this until you stop it. If the result is positive it will display the result under the ‘0 positive’ column and if it’s negative it will display the result under the ‘0 negative’ column. If the resultant value is all over the place then chances are that the research data is not statistically sound. If the resultant value is consistent and, of course, with a positive value then the research is acceptable.
Saving the study
If you are satisfied with the way that the study came out you can save it for future use. Use the NeuroNet analyzer to load this research file to analyze a chart file or time span.
After you have finished a research and are completely satisfied with the results the program saves the findings in the chart file. At any time you can load this file and compare it with a chart file.
Let’s say that a research on doctors yielded a sound research model. You have tested the model and everything statistically proves that there is a correlation between doctors. Now take a chart file of teenagers and run it against this model and every chart in the chart file will be rated against the model and given a value.
Another example is to do a research on bad weather. You can then take this research result file and run daily tests for a month. It will weigh each day against this model and then display the results graphically so you can see when the next day that will have bad weather.
This is some of the research that my partner Sergey and myself have been doing.
We did a research on three different professions where we had over 3000 timed charts for each profession and then saved our results.
In the following graph we compare the results of a research with three different people: Mozart, Einstein, General Ulysses S. Grant. As you can see it predicts the profession of those three men surprisingly well.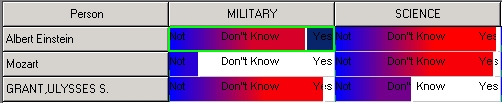
These are only a few of the features that Astro Investigator research program offers!