The 24 K Gold Market Trader Program
 $2495.00
The 24K Gold has all the features of the Bronze and the Sterling Silver Plus all the following features.
If you are a serious trader (not just a hobbyist or occasional trader), we recommend that you consider beginning with Market Trader 24K Gold. In addition to all the modules described above, the Gold contains a most important module called Composite Analyzer.
The Composite Expert module shows how the astronomical cycles move the market.
The following Composite diagram shows the effect of Sun-Jupiter cycle on Aetna stock:
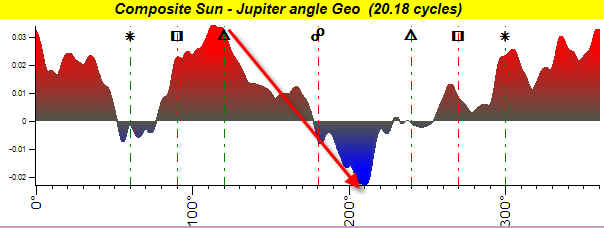
As you see, the price declines when the angle between the Sun and Jupiter is in the range of 120 and 210 degrees. We can reveal the planetary portrait of any financial instrument with this module. For people who want to do research on planetary cycles, the Market Trader allows you to view every cycle individually or let the program do all the work for you by analyzing hundreds of them at one time.
This module takes the historical price for any stocks or markets, calculates every day that each Astrological criteria occurs, and displays an average price movement graph. You can work with transits to transits (planets in the sky) or transits to a natal chart (1st trade or corporation horoscope). These studies can be done with aspects, planets and signs, planets positions, midpoints, planetary phases (even aspects in planetary phases). The study can be calculated in geocentric, heliocentric, declination, right ascension, and geocentric latitude.
The program calculates and finds all the planetary cycles that strongly predict the major moves for the stock under study. Then it goes one step further using special math to optimize every important planetary cycle and tweak the cycle for its best performance. From this study the computer will then give you ‘buy and sell’ days for future trading. It will compare the profit one can make buying and selling using this calculated composite model to the beginning of the cycle (had you bought it then) and sold at the end of it. This is an amazing and very accurate concept.
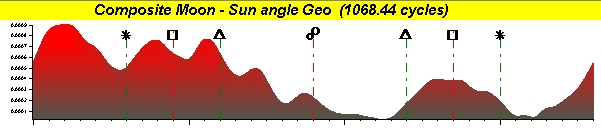
The following graph shows the composite cycles between the transiting Moon and Transiting Sun, known as moon phases, for 88 years of the Dow Jones. The aspects are displayed on the graph for the composite results. Notice that the Dow is the highest at the New Moon and lowest at Full Moon phase.
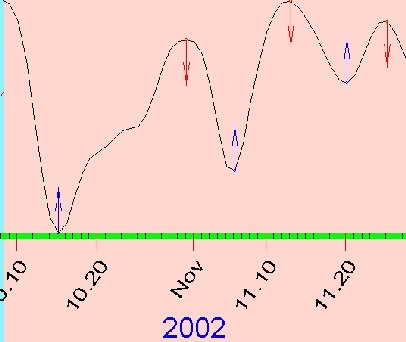
The following graph shows buy and sell signals for IBM, calculated from the sum of 2 composite cycles. The cycles are transiting Sun to natal Saturn and transiting Sun to natal Jupiter. The blue arrow designates buying and the Red selling. If you had bought and sold 1000 shares of IBM using this model you would have made over $25,000 in three trades in just over one month.
This module also allows you to do hundreds of studies using all kinds of different Astrological criteria in beautiful graphics.
Check the article on Dow Jones Astro Study under Financial Articles on this web page to see the potential of this module.
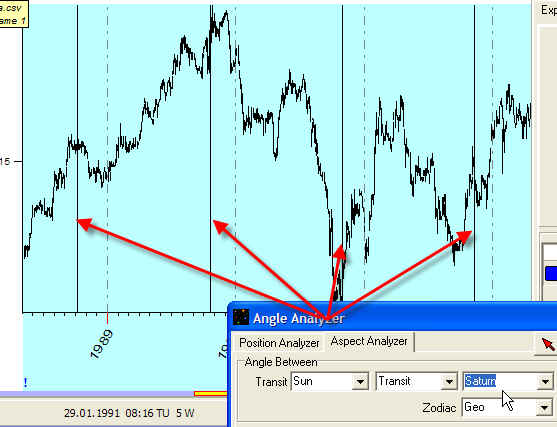
The Angle analyzers module reveal another kind of “planetary memory” for the stock market.
This module is used to quickly view how planetary positions or openings between planets affect certain markets. Just set a planetary pair and an angle opening between the two, and the program will draw lines on the price graph for the appropriate dates. You can quickly find if there are any significant openings between a pair planets using the slider switch.
The following example uses the angle analyzer to display the turning points that often occur when the angle between the Sun and Saturn is close to 290 degrees:
The Stepping Analyzer module is a excellent technique that was developed by George Bayer. Choose a planetary pair at any top or bottom of a market and from that point continue adding preset angular openings to that location to find the turning point. This module offers excellent techniques to find turning points in any market. These lines can be projected as far into the future as you want.
This is different from drawing lines at every set degree of opening. Here we set an original starting point and from that degree opening between the two planets we keep adding preset degree multiples. You can add any multiple that you want. Let’s say that at the high the opening between Jupiter and Saturn was 58 degrees. It will add 15 degrees to that opening and draw the next line on the day that Jupiter Saturn has an opening of 73 degrees. It will add another 15 degrees and draw the next line when Jupiter and Saturn has an opening of 88 degrees and so on. It works as well with the Dow Jones with Jupiter/Sun opening of 30 degrees and Mars/Saturn opening of 45 degrees.
These lines can be projected into the future and with one click of the mouse you can view the dates and times on these projected forecast lines.
The following graph displays a 45° stepping between the Sun and the planet Jupiter from the 1st bottom for the Dow Jones.
The Larry Expert module allows you to work with the Golden mean and Fibonacci numbers. This module can help you locate the next price level or the next turning point. You can add any of your own retracement ratios to use with this module and set the forecast for price or time.
The Bradley barometer module allows you to work with the techniques of the Donald Bradley Barometer.